
Ivysim
Picoblaze Debugger
User Guide
Introduction
Picoblaze Debugger is a simple application that works with ModelSim. It lets you observe the state of a Picoblaze core in your design, control simulation stepping and running to break points. Picoblaze instances and connected program block RAMs in your design are found automatically. You are prompted to specify a PSM file for assembly. The assembled program is written into block RAM. That's it. You are ready to debug Picoblaze code.
Launching Picoblaze Debugger from ModelSim
- Download the zip file from the link on this page.
- Unzip it into a suitable directory of your windows machine.
- In ModelSim's transcript window type this command:
eval [exec { C:/path_to_pbug/pbug.exe } modelsim]
Where C:/path_to_pbug will depend upon where you unzipped the zip file.
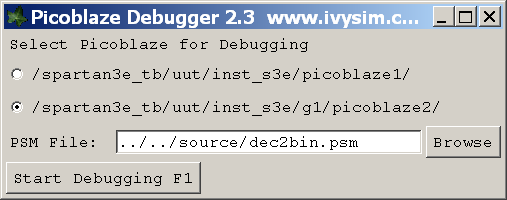 When a design is loaded into ModelSim the debugger will present a list of Picoblaze instances.
Choose a Picoblaze to debug and identify its PSM filename.
There is no need to assemble it using Xilinx's nor Mediatronix assemblers.
The assembler for simulation purposes is built in.
When a design is loaded into ModelSim the debugger will present a list of Picoblaze instances.
Choose a Picoblaze to debug and identify its PSM filename.
There is no need to assemble it using Xilinx's nor Mediatronix assemblers.
The assembler for simulation purposes is built in.
Flags and Registers
The program counter (PC), Zero flag, Carry flag and registers are displayed. Recently modified values are highlighted with a different background colour, drawing your attention to unexpected changes. The fully licensed version also displays the scratchpad registers and values can be changed forcing the values in the simulation to change. This is a powerful feature that allows, say, the Zero flag to be toggled to avoid a long delay loop while interactively exploring program operation.
Code Window
Your PSM program is displayed in the code window with the next instruction to execute highlighted. Line numbers are shown in the first column for easy reference to your original PSM file. Program addresses, 000-3FF, are shown in the third column indicating executable instruction lines. Moving the mouse pointer over register names, constant names, address labels and flags causes a popup window to appear giving relevant information. Constant and register popup windows show values in binary, decimal, hexadecimal and ASCII for printable characters. Hovering over a condition flag such as Z or NC displays a popup showing the present logical condition, True or False.
Break Points
Break points are set by clicking executable lines in the code window. Not all lines are executable, a hand appears when the cursor hovers over executable lines. One mouse-click makes a red bp appear in the second column, a permanent break point. The simulator pauses whenever the Picoblaze reaches this line. A second mouse-click turns the bp green, a temporary break point. The simulator will pause on this line and automatically clear the break point. A third mouse-click clears the break point. So, three mouse-clicks cycle through the 3 states: permanent, temporary and no break point.
It can be very helpful to preserve break points between debugging sessions. The <bp> or <bp_temp> tag in the comment region of an instruction line causes a break point to be set. Permanent or temporary. Being a comment it does not affect the program and is ignored by the assembler. Only PicoBlaze Debugger reads these tags.
Stepping and Running
A single instruction may be executed by clicking the Step button or typing F10, while the debugger window has the focus. The simulator runs until the current instruction has completed and the registers are updated. Many instructions can be executed with the Run button or by typing F5, while the debugger window has the focus. Without breakpoints set the simulator will run until some event outside PicoBlaze Debugger stops it or a breakpoint is set and hit.
The registers, flags, memory and code windows still update several times a second while simulation is running.
Restart
After saving code changes there is no need to recompile any files in ModelSim or restart the simulator. Simply click Restart and Start Debugging again. Or, more quickly press F1 twice. This causes the assembler to run again and reload your PSM file.
If the loaded program is different from the program in Block RAM then it will be reprogrammed inside ModelSim. After the Block RAM is reprogrammed the PicoBlaze is reset so the program counter will go back to 000. The PicoBlaze reset does not affect register or scratch pad memory. If necessary these can be changed if you have the interactive features of the full licence.
Also click Restart if you want to debug another Picoblaze from the same design.
Use your favourite text editor to modify PSM files outside PicoBlaze Debugger.
PicoBlaze and Block RAM Models
The IvySim PicoBlaze Debugger is engineered around KCPSM3 for Xilinx FPGAs. It works with all FPGAs starting with Spartan-3 and Virtex-II. Operation of this debugger relies upon registers that exist in the unmodified PicoBlaze code and the Unisim model used by the template program Block RAM. Your PicoBlaze designs should use the original models downloaded freely from Xilinx.
If your design contains a PicoBlaze but does not use the standard Block RAM then the debugger will still work but you must ensure the Block RAM VHDL matches the program.
Short Cuts
Rapid development demands keyboard speed and minimal mouse work. These keyboard shortcuts control events:
| F1 | Start Debugging or Restart |
| F2 | PicoBlaze Reset (Full licence) |
| F5 | Run to Break Point |
| F10 | Single Step |
| F11 | Single Step over CALL instructions (Full licence) |
| Alt-Z | Toggle Zero Flag (Full licence) |
| Alt-C | Toggle Carry Flag (Full licence) |
Bug Reporting
Please report all bugs and strange behaviour to the email address below. Updates can be created very quickly as this project is currently funded thanks to increasing licence revenues.
The parser is brand new. We have collected a large body of example PSM files in both Xilinx and Mediatronix styles for regression testing. However, there may be something that we have missed. Please report any unexpected errors with as much information as possible. Bug fix releases should follow quite quickly.
Download and Install
Download your copy from the link on this page. Unzip the archive. Copy the files into a suitable installation directory. Run pbugd.exe, it will give you the command that must be copied into ModelSim's console window. Add this to your ModelSim compile script to launch the debugger each time.
Licence
Without a licence file the program will run indefinitely in evaluation mode. You are welcome to use the debugger in evaluation mode free of charge. Without the licensed features it is still very useful and may have all the functionality you need.
Maximising PicoBlaze development productivity requires the fully licensed features. To unlock these you must obtain a licence.txt file from Ivybridge Simulation. The licensing mechanism locks the program to a specific Media Access Controller address. Please send email with your computer's MAC address. This can be discovered by running this command in a DOS window:
C:\>ipconfig /all
Supply either the Local Area Connection or Wireless Network Connection Physical Address. We will send purchasing information and a licence.txt file with a short expiration period for you to try the full licence features.
Mediatronix Differences
There are some major differences in syntax and some subtle ones too.
Mediatronix incl directives are supported for including declaration files.
Mediatronix static expressions are parsed, that is, mathematical combinations of constant and literal values.
Mediatronix constant names are case insensitive whereas Xilinx constants are case sensitive. For example, Mediatronix does not distinguish between character_a and character_A.
Exactly the opposite case sensitivity is true for address labels.
Mediatronix ROMs, RAMs and IOs are treated as constants so that port accesses are performed correctly. The necessary hardware is assumed to have been included in the HDL design around the PicoBlaze. Of course the advantage of PicoBlaze Debugger is that the actual RTL synthesisable peripherals can be simulated while debugging the PSM code.
Xilinx Expertise
Modelling, especially using ModelSim, is an Ivysim speciality. IvySim project consulting in Verilog/VHDL and Tcl scripting has helped our customers improve design quality and reduce project time. We can help you design and verify Xilinx projects. Please call or email to discuss solutions.
Xilinx and PicoBlaze are trademarks of Xilinx Inc. Mediatronix is a trademark of Mediatronix.